How to Use Technical Analysis to Predict Market Trends

Introduction
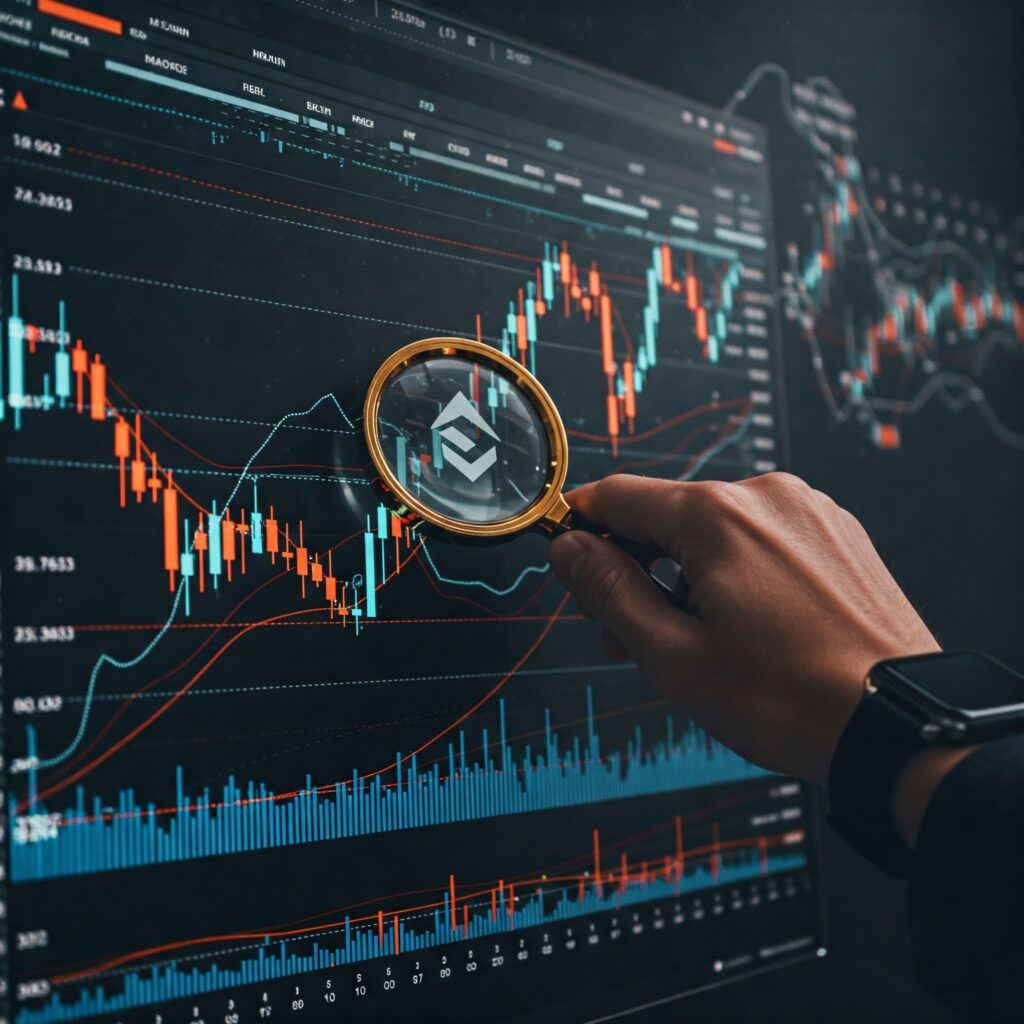
Have you ever wondered how traders predict crypto price movements? If you’ve seen charts full of lines and indicators, you’re looking at technical analysis (TA). This method helps traders make informed decisions based on past price patterns.
Understanding technical analysis can help you avoid emotional trading and improve your chances of success. In this guide, we’ll break down technical analysis in simple terms and show you how to use it effectively. By the end, you’ll be equipped with the basics to start analyzing crypto markets like a pro.
Understanding the Topic
What is Technical Analysis?
Technical analysis is a trading strategy that examines historical price data to predict future movements. It relies on charts, indicators, and patterns to identify trends. Unlike fundamental analysis, which looks at a crypto project’s long-term potential, technical analysis focuses on short-term price movements.
Why is Technical Analysis Important?
Crypto markets are highly volatile. Prices can swing drastically within hours. Technical analysis helps traders identify the best entry and exit points, reducing risks and maximizing profits. Even if you’re new to crypto, learning basic technical analysis can improve your trading decisions.
A Brief History of Technical Analysis
Technical analysis has been around for centuries. It was first used in stock markets and later applied to crypto. One of its pioneers was Charles Dow, who introduced the Dow Theory in the late 1800s. Over time, traders developed new tools and strategies, making technical analysis more advanced and reliable.
Key Benefits / Advantages
1. Helps Identify Trends
Technical analysis helps traders spot uptrends (bullish markets) and downtrends (bearish markets). By recognizing trends early, you can decide whether to buy, sell, or hold.
2. Provides Clear Entry and Exit Points
Using technical indicators, traders can determine the best times to enter and exit trades. This reduces the risk of making impulsive decisions.
3. Works in Any Market Condition
Unlike fundamental analysis, which focuses on long-term growth, technical analysis can be used in both bullish and bearish markets. It provides insights into short-term price movements.
4. Helps Manage Risk
With tools like stop-loss orders, traders can limit their losses. Technical analysis enables you to set realistic risk-to-reward ratios before making trades.
5. Uses Data, Not Emotions
Many traders lose money because they let emotions drive their decisions. Technical analysis relies on historical data, reducing the impact of fear or greed.
Step-by-Step Guide / How-To
1. Choose a Reliable Charting Platform
Platforms like TradingView, Binance, and CoinMarketCap provide interactive charts with technical indicators. Sign up for a free account and explore their features.
2. Understand Candlestick Charts
Candlestick charts are essential in technical analysis. Each candlestick represents a specific time frame and shows the opening, closing, highest, and lowest prices.
- Green Candlestick = Price increase
- Red Candlestick = Price decrease
3. Learn Common Technical Indicators
Moving Averages (MA)
- Simple Moving Average (SMA): Calculates the average price over a set period.
- Exponential Moving Average (EMA): Places more weight on recent prices for quicker trend detection.
Relative Strength Index (RSI)
- Measures market momentum.
- RSI above 70 = Overbought (potential sell signal).
- RSI below 30 = Oversold (potential buy signal).
Bollinger Bands
- Shows volatility.
- Wider bands = High volatility.
- Narrow bands = Low volatility.
MACD (Moving Average Convergence Divergence)
- Identifies trend direction and momentum.
- When MACD crosses above the signal line, it’s a bullish sign.
- When MACD crosses below the signal line, it’s a bearish sign.
4. Identify Support and Resistance Levels
- Support Level: A price level where buying pressure is strong, preventing the price from falling further.
- Resistance Level: A price level where selling pressure is strong, preventing the price from rising further.
5. Practice with a Demo Account
Before investing real money, test your technical analysis skills on a demo trading account. This will help you gain confidence without financial risk.
Common Problems & Solutions
1. False Signals
- Solution: Use multiple indicators to confirm trends instead of relying on one.
2. Overcomplicating Analysis
- Solution: Stick to a few key indicators instead of using too many, which can lead to confusion.
3. Ignoring Market News
- Solution: While technical analysis focuses on price movements, external events (like regulations or hacks) can impact the market. Always stay updated.
4. Emotional Trading
- Solution: Set clear rules for entry and exit. Stick to your strategy without letting emotions influence decisions.
Future Trends / What’s Next?
AI and Machine Learning in Technical Analysis
More traders are using AI-powered bots to analyze charts and execute trades automatically.
On-Chain Data Integration
New tools integrate blockchain data with technical analysis, providing deeper insights.
Growing Popularity of Automated Trading
Many platforms now offer automated trading features, allowing users to execute strategies without manual intervention.
Conclusion & Final Thoughts
Technical analysis is a powerful tool for predicting crypto market trends. By learning how to read charts and use indicators, you can make better trading decisions. Remember, no strategy is 100% accurate, but technical analysis can increase your chances of success.
Start small, practice with a demo account, and refine your strategy over time. If you found this guide helpful, share it with others and leave a comment below!
FAQ
1. Can technical analysis guarantee profits?
No. Technical analysis improves decision-making but does not guarantee profits. Markets are unpredictable, and risks are always involved.
2. What is the best technical indicator for crypto trading?
There is no single “best” indicator. Many traders use a combination of RSI, MACD, and moving averages for better results.
3. Is technical analysis better than fundamental analysis?
Both are useful. Technical analysis is great for short-term trading, while fundamental analysis is better for long-term investments.
4. How much time does it take to learn technical analysis?
It depends on your dedication. Some traders grasp the basics in a few weeks, while mastering it takes months or years.
5. What are the best resources to learn technical analysis?
Books like “Technical Analysis of the Financial Markets” by John Murphy and online courses on TradingView are excellent starting points.
Meta Description
Learn how to use technical analysis for crypto trading. Discover key indicators, strategies, and expert tips to predict market trends like a pro.
Tags
#CryptoTrading #TechnicalAnalysis #Bitcoin #CryptoInvesting ##MACD #CandlestickCharts #CryptoForBeginners